Achievement Rates Traineeship Analysis
This report applies only to English contracts.
Certain learning aims are excluded from the traineeship Achievement Rates. The exclusion rules are applied based on the QAR ruleset that you run the report with (this can be chosen in the parameters):
- Traineeship Achievement Rates 2020/21 specification
- Traineeship Achievement Rates 2021/22 specification
- Traineeship Achievement Rates 2022/23 specification
The Achievement Rates Traineeship Analysis report shows Traineeship Achievement Rate figures under a number of groupings. The groupings are highly customisable to allow for in-depth analysis.
Parameters
- Exclude obsolete assessors - When set to Yes, this will remove obsolete assessors from the filter parameters (if assessor is chosen as a grouping). Also, if grouped by assessor, it will group learners with obsolete assessors under a No assessor grouping.
- Contract years – This lets you choose the contract years to show on the report.
- Row grouping / Row filter 1, 2 and 3 – These let you choose up to three custom row groupings for the report. Each grouping has a corresponding filter option (e.g. grouping by assessor will provide a list of assessors to choose from).
- Column grouping / Column filter 1, 2 and 3 - These work in the same way as the row groupings / filters, except the groupings appear in the columns rather than the rows (under the contract years).
- Disable groupings (i.e. only use filters) - This can be used to disable groupings so that only their accompanying filter is applied. For example, if you wish to filter but not group by centre, set one of the grouping / filter parameters to centre and choose the filters, and then select that grouping in the Disable groupings parameter.
- Forecast – This lets you choose whether the report should show the actual, current figures or forecast the best case or worst case scenario. See the Forecasting section for details.
- Use MLP table for thresholds – This allows you to choose whether the 'traffic light' threshold (see below for details of the traffic lights) is based on the values entered in the traffic light parameters or the MLP table for SSAs. Please note that there are four colours used: green, yellow, amber and red.
- Green Threshold – This determines the minimum achievement percentage for a green traffic light. The default value is 65. Anything between this and the amber threshold is yellow.
- Amber Threshold – This determines the minimum achievement percentage for a yellow traffic light. The default value is 40. Anything between this and the red threshold is amber.
- Red Threshold – This determines the maximum achievement percentage for a red traffic light. The default value is 25. Anything below this is red.
- QAR ruleset - This lets you choose the achievement rates ruleset to run (e.g. 2020/21 will use the rules from the 2020/21 QAR specification, 2021/22 will use the 2021/22 specification, etc). Whichever ruleset you choose, those rules will be applied to all contract years used in the report.
- Reconcile or predict - See Reconciling vs Anticipated Results.
- Show year-to-date or full year - The default of Full year will include learners who have a timely or overall cohort period in the future (within the current contract year). The Year-to-date option will exclude these learners.
- Assessor types - The assessor types used to determine which assessor results are counted against when the report is grouped by assessor.
- Ready to run – Set this to Yes when all other parameters are set (this prevents the report from running automatically on the default parameters).
Layout
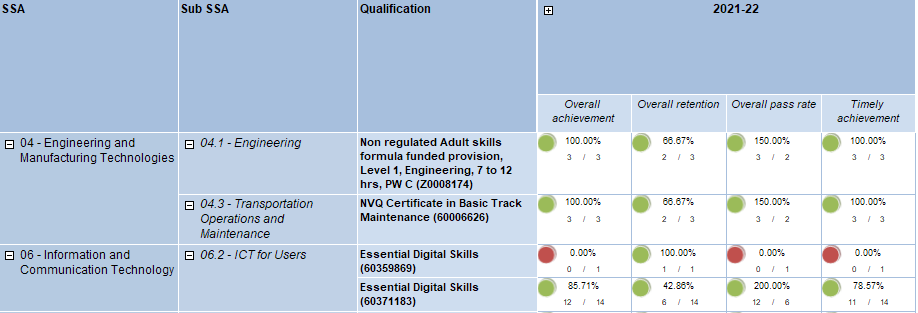
The report data has custom row (left) and column (top) groupings which are determined by the parameters. These can be expanded and collapsed by clicking the  and
and  buttons.
 For each grouping, the data area shows one of four measures:
- Overall achievement - This shows the percentage of achieved aims (left hand figure) out of the overall cohort (right hand figure).
- Overall retention - This shows the percentage of completed aims (left) out of the overall cohort (right).
- Overall pass rate - This shows the percentage of achieved aims (left) out of completed aims (right).
- Timely achievement - This shows the percentage of achieved aims (left) out of the timely cohort (right).
Each of these includes a 'traffic light' (green, amber or red) which is set according to the values in the threshold parameters. This allows you to quickly see general achievement levels for each area.
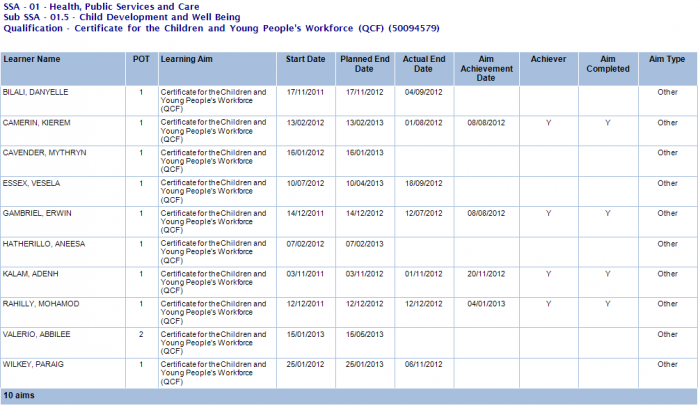
Clicking the left or right hand number in any cell will show a list of the relevant aims.
Explanation of Timely and Overall Cohorts
Achievement Rates are measured in overall and timely cohorts, which are defined by the ESFA. A cohort is simply a group of aims during a period of time. The Maytas Achievement Rates reports distinguish between cohort years (based on contract years) and cohort months. For example, an aim with a timely cohort month of August 2021 would have a timely cohort year of 2021/22.
Timely Cohort
An aim's timely cohort is determined by the month/year in which the planned end date falls. For example, if an aim had a planned end date of 01/09/2021, the timely cohort month would be September 2021 and the timely cohort year would be 2021/22.
To be a timely achiever, an aim must be achieved within 90 days of the planned end date (or before the planned end date). This requires a completion status of 2 (completed) and an outcome of 1 (achieved). If an aim is a timely achiever, the timely achiever cohort year and month is the same as the timely cohort.
It is important to note that the 90 day rule only applies when determining timely achievers, not the timely cohort. i.e. If an aim ends more than 90 days after the planned end date, it would not be counted as a timely achiever but it would still be counted in the timely cohort.
The timely cohort can include live aims as well as ended aims.
Overall Cohort
An aim's overall cohort is determined by the month/year in which the latest out of the planned end date and the actual end date falls. In other words, if the planned end date is after the actual end date, the planned end date is used, otherwise the actual end date is used.
- Example 1 - An aim's planned end date is 01/07/2021 and the actual end date is 01/08/2021. Since the actual end date is the most recent, the overall cohort month is August 2021 and the overall cohort year is 2021/22.
- Example 2 - An aim's planned end date is 01/07/2021 and the actual end date is 01/06/2021. Since the planned end date is the most recent, the overall cohort month is July 2021 and the overall cohort year is 2020/21.
It is important to note that the overall cohort only includes aims with an actual end date, unlike the timely cohort.
To be an overall completer, an aim must have a completion status of 2 (completed). To be an overall achiever, an aim must have a completion status of 2 (completed) and an outcome of 1 (achieved). Unlike the timely cohort, it does not matter when the achievement takes place. If an aim is an overall completer or achiever, the overall completer or achiever cohort year and month is the same as the overall cohort.
Forecasting
The Forecast data parameter has three options:
- Show actual, current results – This is the default option and shows the results as they currently stand, with no forecasting applied.
- Show best case scenario – This forecasts that any aims that are still live and could be achieved, will be completed with achievement on the planned end date.
- Show worst case scenario – This forecasts that any aims that are still live will end as withdrawals on the planned end date.
For the best case and worst case scenarios, if the planned end date is in the past then the completion is forecast for the current period. The exception to this is when aims in the timely cohort are still live and more than 90 days past the planned end date, in which case they are forecast to be completed without achievement in the current period.
There are certain situations worth noting when using the forecasting:
- Past contract years will likely show little or no change, as the forecasting only affects live aims.
- Similarly, when approaching the end of a contract year, it is possible that figures in the current year will show little change if most of the planned end dates for live aims are in the following contract year. This is because the forecasting is based around the planned end date.
Achievement Rates Reconciling vs Anticipated Results
We have received queries and feedback from providers around how the achievement rates data is produced and what that data represents. Since the major QAR rule changes were introduced in January 2017, our intention has been to produce what we expect the latest published QAR results to be. This means that in some cases, data which was exported in recent contract years has been ignored in favour of earlier data, as the earlier data is what we expect the ESFA to be using to produce the latest QARs.
While this is the most accurate way to reconcile against current published figures, it is not useful for showing future expected results based on current data. To address this, the reports allow you to toggle between these two options with the Reconcile or predict parameter:
-
Show expected future published QAR results – This is the default option. When this is selected, it is assumed that any live data which hasn’t been exported will be, such that it is taken into account in future published QAR results.
E.g. If the latest ILR export for an aim has a blank actual end date but on the ILR tab an actual end date has since been entered, the value from the tab will be used in the reports as it is assumed it will be included in an export in the future.
In simple terms, this means the live/current values for actual end date and completion status are used to derive the core figures (i.e. the overall and timely cohorts). Historical data is still checked when applying certain rules, however.
- Show expected current published QAR results – This option works in the same way as the QAR reports in reports library version 1.0.2.5. Historical data from ILR exports up to and including the contract year of the selected ruleset may be used for actual end date and completion status instead of the live values, so that the results reconcile as closely as possible with the current published figures.